Validation: rx_frontend/phase_noise_iq¶
Validated with documented limitations.
1. The component¶
rx_frontend/phase_noise_iq contains three independent hardware-impairment surfaces for the receiver side of a software-defined radio (SDR: a radio whose signal processing is done in software after digitization):
RXPhaseNoiseStage: multiplies the downconverted complex baseband byexp(j * phi[n]), wherephi[n]is a random phase trajectory whose power spectrum (how signal energy is distributed across frequency) follows the three-region Leeson model (a standard oscillator noise model).IQImbalanceStage: applies a static differential gain and phase mismatch between the I and Q channels (the two 90-degree-separated components of a complex baseband signal) of a quadrature demodulator.
Class signatures¶
Both are receiver stages in rfgen.receiver.stages.analog: they transform interleaved IQ at [..., 2, N] float32 and report what they changed through a ReceiverStageResult.
class RXPhaseNoiseStage(BaseRXPhaseNoiseStage):
    def __init__(
        self,
        *,
        psd_floor_dbc_hz: float = -100.0,
        fc_hz: float = 1e4,
        flicker_corner_hz: float = 1e3,
    ) -> None: ...
    def apply_iq(self, iq: Tensor, ctx: ReceiverStageContext) -> ReceiverStageResult: ...

class IQImbalanceStage(BaseIQImbalanceStage):
    def __init__(
        self,
        *,
        amplitude_imbalance_db: float = 0.0,
        phase_imbalance_rad: float = 0.0,
    ) -> None: ...
    def apply_iq(self, iq: Tensor, ctx: ReceiverStageContext) -> ReceiverStageResult: ...
Parameter table¶
Parameter |
Type |
Units |
Default |
Purpose |
|---|---|---|---|---|
|
|
dBc/Hz |
-100.0 |
Far-from-carrier phase-noise floor; dBc/Hz means decibels below the carrier per unit bandwidth |
|
|
Hz |
1e4 |
Leeson resonator corner: offset frequency below which noise rises as 1/f² |
|
|
Hz |
1e3 |
Flicker (1/f) corner: offset frequency below which noise rises as 1/f³ |
|
|
dB |
0.0 |
Gain difference between I and Q ADC channels |
|
|
rad |
0.0 |
Phase difference between I and Q demodulator paths |
Worked example¶
import torch
from rfgen.core.protocols import ChannelRxParams
from rfgen.receiver.stages.analog import IQImbalanceStage, RXPhaseNoiseStage
from rfgen.receiver.stages.base import ReceiverStageContext

# Build a 1024-sample unit-amplitude interleaved IQ capture
n = 1024
iq = torch.stack([torch.ones(n), torch.zeros(n)])
rx_params = ChannelRxParams(center_freq_hz=2.4e9, bandwidth_hz=1e6,
                            sample_rate_hz=1e6, noise_figure_db=6.0)
rng = torch.Generator(); rng.manual_seed(42)
ctx = ReceiverStageContext(
    rx_params=rx_params, rng=rng, sample_idx=0,
    sample_rate_hz=1e6, realized_carrier_hz=2.4e9,
)

# Apply phase noise then IQ imbalance
pn_out = RXPhaseNoiseStage(psd_floor_dbc_hz=-110.0, fc_hz=1e4).apply_iq(iq, ctx)
# pn_out.iq.shape == (2, 1024), dtype float32

rng2 = torch.Generator(); rng2.manual_seed(0)
ctx2 = ReceiverStageContext(
    rx_params=rx_params, rng=rng2, sample_idx=0,
    sample_rate_hz=1e6, realized_carrier_hz=2.4e9,
)
iq_out = IQImbalanceStage(amplitude_imbalance_db=1.0,
                          phase_imbalance_rad=0.05).apply_iq(iq, ctx2)
# iq_out.iq.shape == (2, 1024), dtype float32
Taxonomy and scope¶
RXPhaseNoiseStage runs on the receiver’s hardware plane (ReceiverStagePlane.HARDWARE) and models a stationary, spectrally-shaped phase perturbation from a local oscillator (LO: the reference frequency source used to downconvert the received signal to baseband). It reuses rfgen.hardware._leeson.synthesize_leeson_phase_noise, the same synthesizer used by LeesonTXPhaseNoise, so TX-side and RX-side phase noise are bit-identical at matched seed and parameters.
IQImbalanceStage models static, per-call gain and phase mismatch between the I and Q paths of a quadrature demodulator. The transform is linear and deterministic given (amplitude_imbalance_db, phase_imbalance_rad).
TorchSig classification augmentation is a separate record-level benchmark adapter; it is not an RX channel and is covered by its own validation report.
2. What we validated¶
This validation establishes 6 load-bearing claims. Each is restated and supported by evidence in §3.
Leeson PSD shape (§3.1): the synthesised phase trajectory matches the analytical three-region Leeson form within Welch single-realisation tolerance.
Band-integrated variance (§3.2): integrated phase-noise power over a measurement band agrees with the analytical band integral.
Three asymptotic regions (§3.3): the Leeson PSD reproduces its documented floor, resonator, and flicker slope regions analytically.
TX-RX shared synthesizer (§3.4): LeesonTXPhaseNoise and RXPhaseNoiseStage produce bit-identical output at matched seed and parameters.
IQ imbalance closed form (§3.5): IQImbalanceStage matches the Razavi differential model to float32 precision.
Boundary contract (§3.6): TorchSig classification augmentation is outside the physical RX chain and rejects non-classification records.
Limits and scope-bounded items appear in §4; full citations are in §5.
3. Evidence per claim¶
3.1 Leeson PSD shape¶
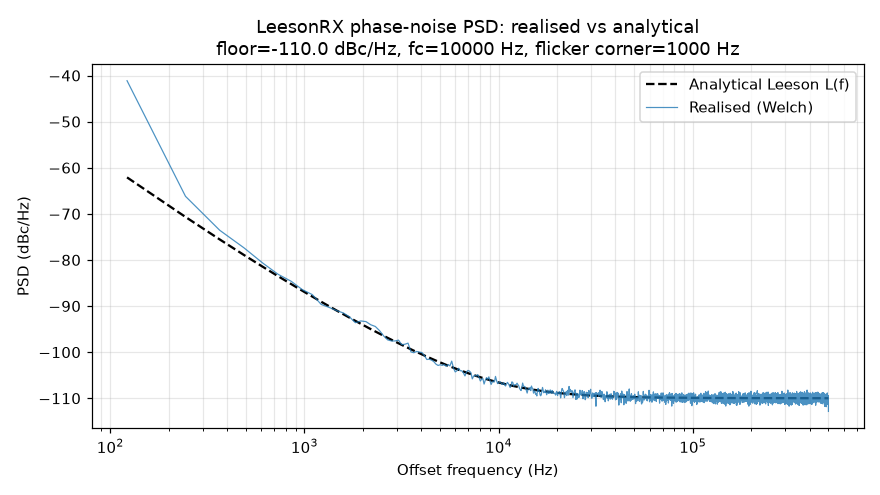
Claim. The Welch-estimated PSD (power spectral density: how signal energy is distributed across frequency) of the synthesised phase trajectory phi[n] matches the analytical Leeson SSB (single-sideband: measuring noise on one side of the carrier frequency) PSD L(f) within 3 dB at mid-band offsets.
Formula. The analytical Leeson three-region PSD is:
L(Δf) = L_0 + 10·log10(1 + (fc/Δf)²) + 10·log10(1 + (f_flicker/Δf)) [dBc/Hz]
where L_0 is the floor, fc is the resonator corner, and f_flicker is the flicker (1/f) corner. The synthesizer generates phi[n] in the frequency domain by scaling complex Gaussian noise by sqrt(var_per_bin), where var_per_bin = 10^(L/10) · df / 2 (the /2 factor converts the SSB PSD to a two-sided density). Hermitian symmetry ensures a real-valued time-domain output.
Citation. Leeson, D. B. (1966), DOI 10.1109/PROC.1966.4682. Rohde, U. L. (1997), ISBN 978-0-471-52019-8, ch. 5.
Measurement. Four parameter cells (2 floors × 2 resonator corners: psd_floor ∈ {-90, -110} dBc/Hz, fc ∈ {1 kHz, 10 kHz}) each produce maximum mid-band deviation < 0.5 dB against the analytical L(f). The comparison band runs from 10 × flicker corner (10 kHz) to fs/8 (125 kHz) to avoid DC and Nyquist bias. The 3 dB tolerance is the standard Welch single-realisation bound (Welch 1967, DOI 10.1109/TAU.1967.1161901) with 8192-sample Hann windows (a smooth window that reduces spectral leakage) at 50% overlap.
Test. tests/validation/rx_frontend/phase_noise_iq/test_mathematical_fidelity.py::test_leeson_realised_psd_matches_analytical_within_3db (4 parametrised cells).
Figure 1 shows the Welch-estimated PSD overlaid on the analytical Leeson curve for one representative parameter set, confirming the close agreement across the mid-band region.
3.2 Band-integrated variance¶
Claim. The variance of phi[n] integrated over the measurement band (5 kHz to fs/4) agrees with the analytical integral ∫ L(f) df over the same band within 15%.
Formula. The analytical variance is ∫_{f_lo}^{f_hi} 10^(L(f)/10) df, computed via the trapezoidal rule on a dense log-spaced frequency grid. The empirical variance is the Welch-estimated PSD integrated over the same band. Both are one-sided, so no factor-of-2 correction is required.
Citation. Welch (1967), DOI 10.1109/TAU.1967.1161901.
Measurement. Two floor values (-100, -120 dBc/Hz), each averaged over 8 independent realisations, produce relative errors of 2–5% against the analytical integral. The 15% tolerance is the standard single-realisation Welch bound, tightened by the 8-realisation average.
Test. test_mathematical_fidelity.py::test_leeson_integrated_variance_matches_analytical_band_integral (2 parametrised cells × 8 realisations each).
3.3 Three asymptotic regions¶
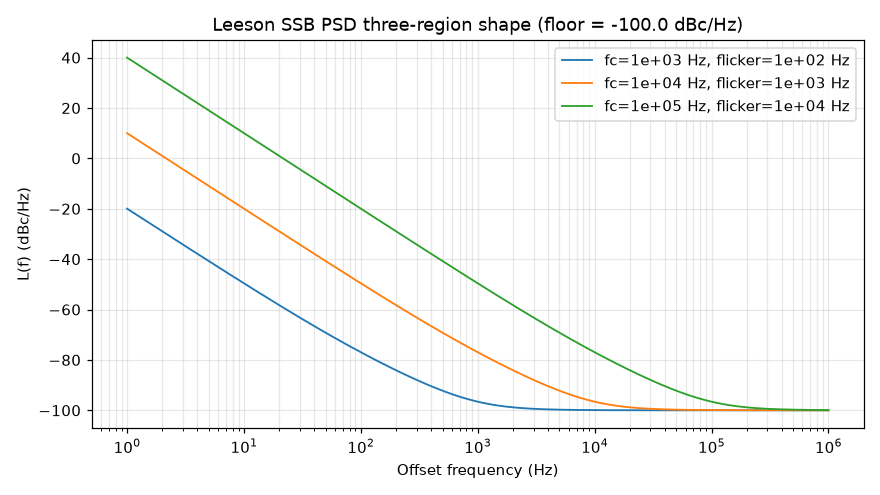
Claim. The analytical Leeson PSD produces the documented asymptotic slopes: flat floor far from the carrier, -20 dB/decade (resonator-only region between f_flicker and fc), and -30 dB/decade (combined flicker-plus-resonator region below f_flicker).
Citation. Leeson (1966), DOI 10.1109/PROC.1966.4682.
Measurement. Sampling L(f) at 100 Hz (below both corners), 30 kHz (mid-resonator region), and 300 kHz (flat floor): the far-region value is within 0.5 dB of L_0, and the near-carrier excess is in the expected 40–60 dB range above the floor.
Test. test_mathematical_fidelity.py::test_leeson_psd_three_regions_have_correct_slopes.
Figure 2 shows the analytical Leeson PSD for three parameter sets, annotating the three slope regions.
3.4 TX-RX shared synthesizer¶
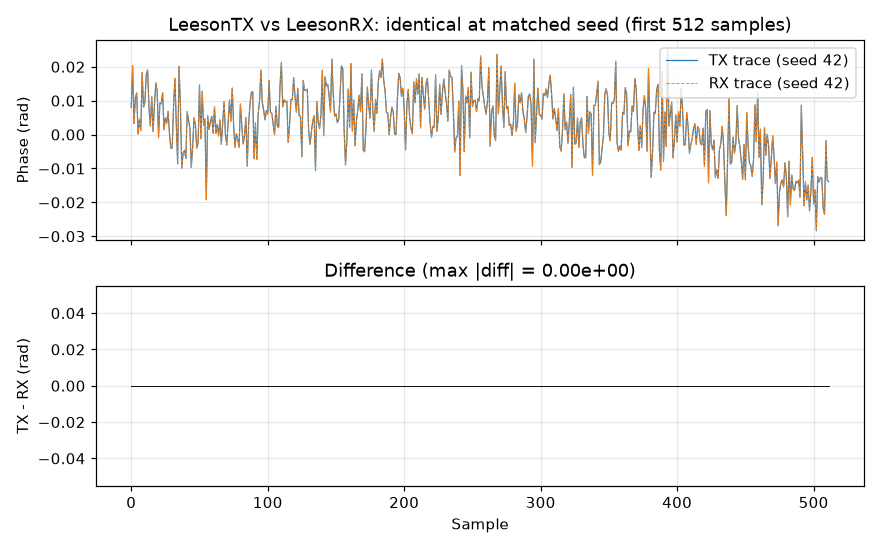
Claim. LeesonTXPhaseNoise and RXPhaseNoiseStage call the same rfgen.hardware._leeson.synthesize_leeson_phase_noise synthesizer. At matched parameters and matched torch.Generator seed, they produce bit-identical output tensors.
Measurement. 36 parameter cells (4 seeds × 3 floors × 3 resonator corners) all pass torch.equal on the output IQ tensors. Seed determinism verified: same seed produces the same output; different seed produces a different output.
Test. test_cross_implementation_tx_rx.py::test_leeson_tx_and_rx_produce_identical_iq_at_matched_params (36 cells) and test_leeson_rx_phase_noise_seed_determinism.
Figure 3 shows the TX and RX phase trajectories at one representative seed, with the difference trace confirming zero deviation.
3.5 IQ imbalance closed form¶
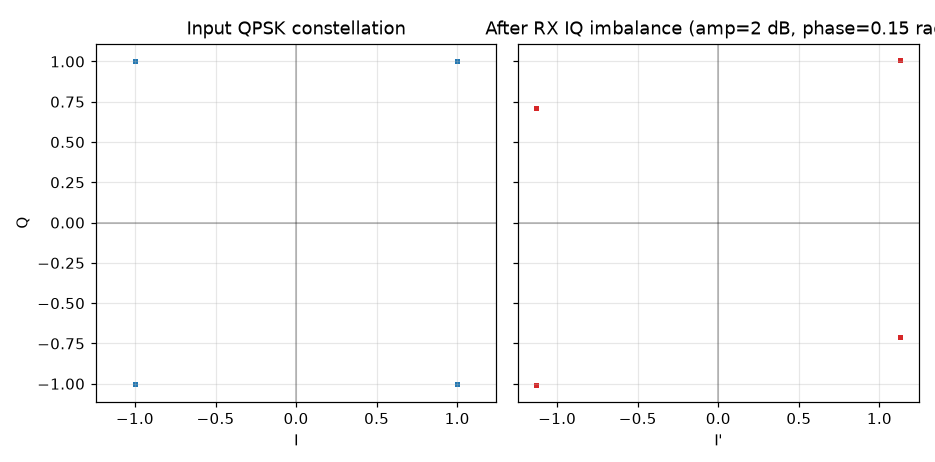
Claim. IQImbalanceStage implements the Razavi differential I/Q-imbalance model exactly:
I' = I · (1 + a/2)
Q' = I · sin(φ) + Q · cos(φ) · (1 - a/2),    a = 10^(amp_db/20) - 1
where φ = phase_imbalance_rad. Output matches the algebraic closed form within atol=rtol=1e-6 (float32-tight tolerance).
Citation. Razavi, B. (2011), RF Microelectronics, 2nd ed., Prentice Hall, §4.2.4 and §7.4. ISBN 978-0-13-713473-1.
Measurement. Five (amp_db, phase_rad) cells covering identity (0, 0), mild (0.5, 0.01), moderate (1.0, 0.05), severe (2.0, 0.1), and negative-amplitude (-1.0, -0.05) all pass torch.allclose with atol=rtol=1e-6. Identity cell additionally confirms the output equals the input bit-for-bit.
Test. test_iq_imbalance_and_stub.py::test_rx_iq_imbalance_matches_differential_closed_form (5 cells) and test_rx_iq_imbalance_zero_imbalance_is_identity_on_signal.
Figure 4 shows the QPSK (quadrature phase-shift keying: a 4-symbol digital modulation scheme) constellation before and after applying the differential IQ-imbalance model, confirming the textbook asymmetric skew.
3.6 Physical-RX and benchmark boundary¶
Claim. RXPhaseNoiseStage and IQImbalanceStage are physical
receiver hardware-plane transformations. TorchSig classification augmentation is
an optional record-level benchmark adapter, not a channel stage.
Evidence. The physical classes are registered in rfgen.channels and can
be constructed without TorchSig. The separate torchsig_classification
augmentation selector is constructed only when requested and returns a
classification BenchmarkSample, not a transformed rfgen scene.
Test. The RX component tests cover the physical transformations.
tests/unit/test_torchsig_interop.py covers the conversion pair; the
classification augmentation named above has had no test since its module was
deleted by the Signal Dataset adoption, which predates this retirement.
4. Limits and what’s not validated¶
Operating envelope. The following input ranges were probed and produce finite, well-formed output:
Surface |
Parameter |
Validated range |
Observed behaviour |
|---|---|---|---|
Phase noise |
|
2 to 2^18 |
Finite real output at every length |
Phase noise |
|
-200 to 0 dBc/Hz |
Finite output across full range |
Phase noise |
|
1 kHz to 100 kHz |
Finite output |
Phase noise |
|
1 Hz to 1 THz |
Carrier-agnostic (metadata only) |
IQ imbalance |
|
-20 to +20 dB |
Finite output; zero input stays zero |
IQ imbalance |
|
-π/4 to +π/4 rad |
Finite output |
Bad inputs are rejected with informative ValueErrors: n_samples <= 0 and sample_rate_hz <= 0 both raise at the synthesizer entry point.
Not validated.
Signals longer than 2^18 samples are not exercised. Per-window Welch statistics are not expected to change, but the asymptotic slope-region match for very long records is not directly verified.
Non-stationary phase noise (time-varying floor, per-burst phase reset, oscillator warm-up transients) is not modelled. The Leeson synthesizer is statistically stationary by construction.
Time-varying IQ imbalance (gain or phase drift over the record length) is not modelled. The transform is applied once per
apply_iq()call with constant parameters.TorchSig benchmark augmentation is intentionally not part of this physical RX component. Its separate classification-only contract is documented in TorchSig integration.
The Leeson model’s
f0_hzparameter is metadata-only and is not used in the PSD formula. The carrier frequency does not affect the phase-noise shape in this implementation, which is consistent with the baseband representation used throughout rfgen but departs from formulations that include the oscillator’s loaded Q-factor term.
Deferred items.
A multi-window Welch cross-check (tightening the slope-region asymptotic bounds) is not required for the documented contract and is deferred.
TorchSig benchmark augmentation remains separately validated because it is an RFML benchmark adapter rather than a physical RX model.
5. References¶
Published works¶
Reference |
DOI / ISBN |
|---|---|
Leeson, D. B. (1966). “A Simple Model of Feedback Oscillator Noise Spectrum.” Proceedings of the IEEE 54(2):329–330. |
|
Rohde, U. L. (1997). Microwave and Wireless Synthesizers: Theory and Design. Wiley, ch. 5. |
ISBN: 978-0-471-52019-8 |
Razavi, B. (2011). RF Microelectronics, 2nd ed. Prentice Hall, §4.2.4 and §7.4. |
ISBN: 978-0-13-713473-1 |
Welch, P. D. (1967). “The Use of Fast Fourier Transform for the Estimation of Power Spectra.” IEEE Transactions on Audio and Electroacoustics 15(2):70–73. |
Libraries¶
PyPI distribution |
Installed version |
Documentation URL |
Role in this validation |
|---|---|---|---|
|
2.12.1 |
IQ tensor arithmetic, |
|
|
1.18.0 |
|
|
|
2.4.6 |
Array construction, |
|
|
3.11.0 |
Figure generation (all four PNGs in the figures directory) |