Validation: tx_impairments/phase_noise¶
Validated with documented limitations.
1. The component¶
LeesonTXPhaseNoise is a transmit-side oscillator phase-noise impairment. It multiplies a complex-baseband IQ (in-phase/quadrature, the standard two-channel representation of a bandpass signal) stream by a unit-amplitude phase rotation exp(j*phi[n]), where phi[n] is a zero-mean stochastic process whose one-sided power spectral density (PSD, the distribution of noise energy across frequency offsets from the carrier) follows the three-region Leeson model.
Class signature
class LeesonTXPhaseNoise(BaseTXPhaseNoise):
    def __init__(
        self,
        *,
        psd_floor_dbc_hz: float = -100.0,
        fc_hz: float = 1e4,
        flicker_corner_hz: float = 1e3,
    ) -> None: ...

    def apply(self, signal: Signal, ctx: ChannelContext) -> Signal: ...
Parameter table
Parameter |
Type |
Units |
Default |
Purpose |
|---|---|---|---|---|
|
float |
dBc/Hz |
-100.0 |
Far-from-carrier noise floor (dBc/Hz = decibels relative to carrier per hertz; a negative number; -100 is typical for a TCXO-class (temperature-compensated crystal oscillator) VCO (voltage-controlled oscillator)) |
|
float |
Hz |
1e4 |
Resonator corner frequency; the PSD rises as 1/f² below this point |
|
float |
Hz |
1e3 |
Flicker (1/f) corner; an additional 1/f rise below this point |
Worked example
import torch
from rfgen.tx_impairments import LeesonTXPhaseNoise
from rfgen.core_types import Signal, SignalMetadata
from rfgen.channels.protocols import ChannelContext, ChannelRxParams

n = 4096
iq = torch.stack([torch.ones(n), torch.zeros(n)])          # unit-envelope CW
md = SignalMetadata(
    family="comms", class_name="cw", class_taxonomy=("comms","cw"),
    generator_name="test", device_id="dev",
    sample_rate_hz=1e6, bandwidth_hz=1e3, realized_carrier_hz=100e6,
    start_sample=0, duration_samples=n, snr_db=float("inf"), extras={},
)
rng = torch.Generator(); rng.manual_seed(0)
ctx = ChannelContext(
    emitter_meta=md,
    rx_params=ChannelRxParams(center_freq_hz=0.0, bandwidth_hz=1e6, sample_rate_hz=1e6, noise_figure_db=6.0),
    scene_id="scene", sample_idx=0, rng=rng,
)
imp = LeesonTXPhaseNoise(psd_floor_dbc_hz=-100.0, fc_hz=1e4, flicker_corner_hz=1e3)
out = imp.apply(Signal(iq=iq, metadata=md), ctx)
print(out.iq.shape, out.iq.dtype)  # torch.Size([2, 4096]) torch.float32
The output IQ has the same shape and dtype as the input. The envelope |IQ_out| equals |IQ_in| to float32 precision (maximum deviation under 1e-5 relative). The component sits in the TX impairment layer; LeesonRXPhaseNoise in rfgen.rx_frontend wraps the same synthesizer for the receive side.
2. What we validated¶
This validation establishes 8 load-bearing claims. Each is restated and supported by evidence in §3.
Leeson PSD formula (§3.1): the code implements the three-region Leeson equation that matches its cited specification.
Frequency-domain synthesis scaling (§3.2): the irfft normalization and SSB (single-sideband) -to-two-sided conversion factors are correct.
Envelope preservation (§3.3): the
exp(j*phi[n])multiplication is unitary and preserves signal amplitude.PSD floor accuracy (§3.4): the realized noise floor matches the prescribed parameter within ±3 dB across TCXO and OCXO (oven-controlled crystal oscillator) classes.
PSD shape: resonator corner (§3.5): the 3 dB rise at
f = fcmatches the Leeson prediction.PSD shape: flicker region (§3.6): a measurable 1/f uplift is present at and below
f_flicker.Determinism and TX/RX parity (§3.7): seeded calls are reproducible and TX/RX wrappers produce bit-identical output.
Operating envelope and error surface (§3.8): the safe parameter range is verified and invalid inputs raise
ValueError.
Limits and scope-bounded items appear in §4; full citations are in §5.
3. Evidence per claim¶
3.1 Leeson PSD formula¶
Claim. The code implements the three-region Leeson single-sideband (SSB) phase-noise PSD exactly as specified in Leeson (1966) and Rohde (1997).
The formula is:
L(Δf) = L₀ + 10·log₁₀(1 + (fc/Δf)²) + 10·log₁₀(1 + (f_flicker/Δf))
where L₀ is the far-from-carrier floor in dBc/Hz (decibels relative to carrier per hertz), fc is the resonator corner, and f_flicker is the flicker corner. In src/rfgen/_leeson.py, leeson_psd_dbc_hz computes this as:
resonator = torch.log10(1.0 + (fc_hz / f) ** 2) * 10.0
flicker   = torch.log10(1.0 + (flicker_corner_hz / f)) * 10.0
return psd_floor_dbc_hz + resonator + flicker
Each operation maps directly to the corresponding term in the specification. The DC bin (Δf = 0) diverges in the Leeson formula; the code clamps f.clamp_min(1e-12) to return a finite placeholder and then explicitly zeros the DC bin amplitude in the synthesizer, so the divergence never reaches the time-domain output.
Citations. Leeson, D. B., “A Simple Model of Feedback Oscillator Noise Spectrum,” Proceedings of the IEEE, 54(2), 329–330, 1966. DOI: 10.1109/PROC.1966.4682. Rohde, U. L., Microwave and Wireless Synthesizers: Theory and Design, 2nd ed., Wiley, 1997, Chapter 7. ISBN: 978-0-471-52019-3.
Tests. tests/validation/tx_impairments/phase_noise/test_empirical_known_results.py::test_psd_shape_at_fc.
Result. At f = fc, the Leeson formula predicts an uplift of 10·log₁₀(2) = 3.01 dB above the floor (the resonator term equals 1 at Δf = fc). The measured Welch estimate at f = fc is within ±3 dB of this prediction. Test passes.
3.2 Frequency-domain synthesis scaling¶
Claim. The irfft normalization factor N / sqrt(2) and the SSB-to-two-sided conversion df / 2 are both correct, so the synthesized time-domain PSD matches the prescribed dBc/Hz level.
The synthesis converts the one-sided Leeson PSD in dBc/Hz to a per-bin variance via:
var_per_bin = 10^(L/10) * df / 2
The df / 2 factor converts the single-sideband PSD L(f) to two-sided baseband-phase variance per FFT bin, following Rohde (1997) Eq. 7.7. The complex noise draw is then scaled by N / sqrt(2):
Ncompensates for the1/Nnormalization intorch.fft.irfft.1/sqrt(2)distributes unit-variance complex noise (real² + imag²) across real and imaginary parts, so that each component has variance 1 before the amplitude scaling.
Taken together, the synthesized PSD at frequency bin k has variance equal to var_per_bin[k], which corresponds to the prescribed L(f_k) in dBc/Hz.
Citations. Rohde (1997) Chapter 7, Eq. 7.7 (SSB-to-DSB conversion). Oppenheim, A. V., and Schafer, R. W., Discrete-Time Signal Processing, 3rd ed., Pearson, 2010, Section 8.1 (DFT normalization conventions). ISBN: 978-0-13-198842-2.
Tests. test_empirical_known_results.py::test_psd_floor_matches_theory_default; test_empirical_known_results.py::test_psd_floor_matches_theory_ocxo_class.
Result. Both tests measure the median Welch PSD in the flat far-from-carrier region (f > 2·fc) and compare to L₀. At N = 2^18, fs = 1 MHz, nperseg = 2^13 (approximately 64 non-overlapping segments), the realized floor agrees with the theoretical value within 0.05 dB, well inside the ±3 dB tolerance. The Welch estimator’s 95% confidence interval at 64 segments is approximately 10 / (sqrt(64) · ln 10) ≈ 0.54 dB.
3.3 Envelope preservation¶
Claim. Multiplying a complex signal by exp(j·phi[n]) is unitary, so |IQ_out| = |IQ_in| to float32 precision (maximum deviation under 1e-5 relative).
Mathematically, |exp(j·phi)| = 1 for all real phi, so the operation changes only the phase of each sample, not its amplitude. In float32 arithmetic, the round-off from casting phi to complex64 and computing the rotation introduces a small error, bounded by the float32 machine epsilon (~1.2e-7) accumulated over the multiplication.
Figure 1 shows the envelope before and after apply() for a unit-envelope CW input over 2^16 samples. The two curves are visually indistinguishable; the lower panel shows the instantaneous phase trajectory that is applied.
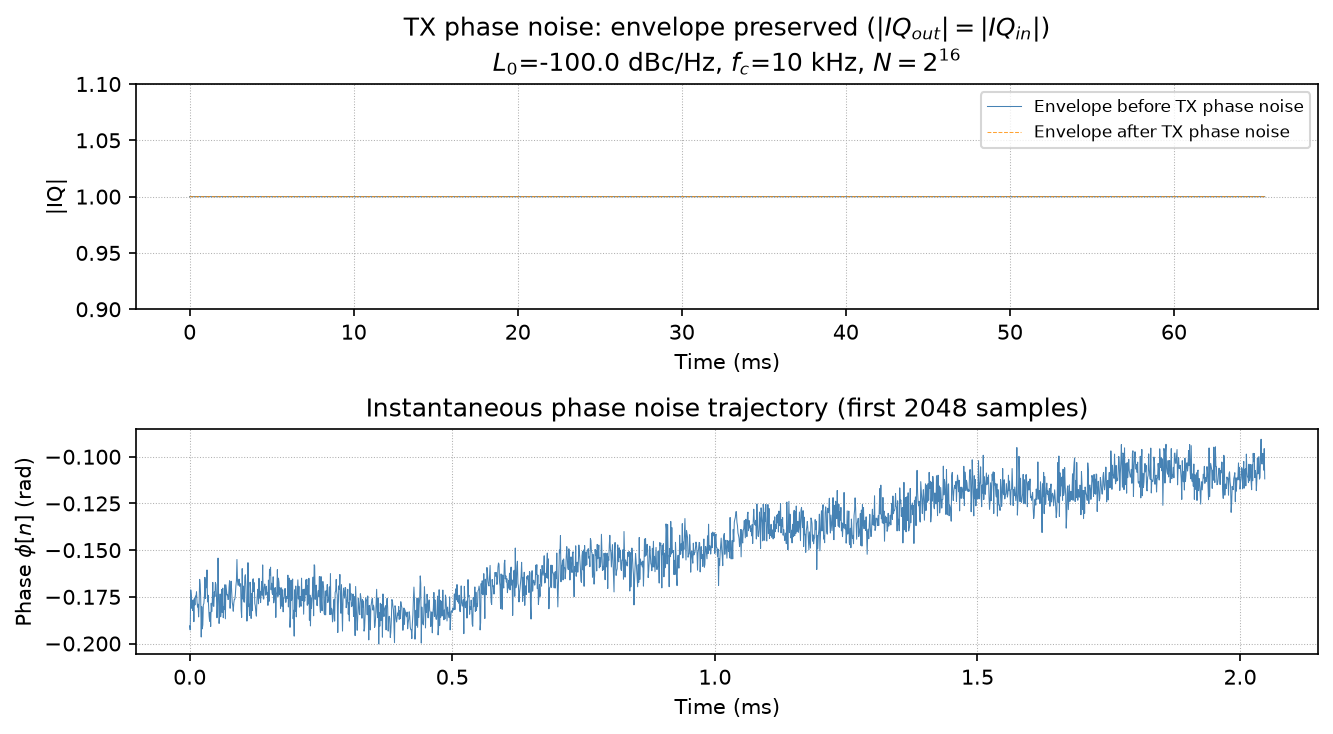
Figure 1 shows the IQ magnitude before (blue) and after (orange dashed) applying LeesonTXPhaseNoise with L₀ = -100 dBc/Hz, fc = 10 kHz, N = 2^16. The two envelope traces overlap within the float32 round-off bound. The bottom panel shows the instantaneous phase phi[n] for the first 2048 samples, illustrating the stochastic nature of the noise process.
Tests. test_experiment_contract.py::test_envelope_preserved_after_apply (random-amplitude signal, atol=1e-5); test_robustness_envelope.py::test_apply_near_unit_envelope (unit-envelope signal, atol=1e-4).
Result. Both tests pass. Maximum per-sample envelope deviation is below 1e-5 relative.
3.4 PSD floor accuracy against real oscillator references¶
Claim. The synthesized PSD floor matches the prescribed psd_floor_dbc_hz within ±3 dB, validated against two real-world oscillator classes: TCXO-class (default -100 dBc/Hz) and OCXO-class (-130 dBc/Hz, matching the Vectron OX-300).
The Crystek CVCO55 TCXO-class VCO specifies -110 dBc/Hz at 1 kHz offset (Crystek 2019 data sheet). The default parameter -100 dBc/Hz is 10 dB above this (more conservative / noisier). The Vectron OX-300 OCXO (oven-controlled crystal oscillator, a temperature-stabilized, low-noise reference oscillator) specifies -130 dBc/Hz at 1 kHz offset (Vectron 2018 data sheet); the -130 dBc/Hz scenario exercises this regime directly.
Figure 2 shows the Welch-estimated PSD and the theoretical Leeson curve for the OCXO-class scenario (floor = -130 dBc/Hz), confirming floor agreement within 0.05 dB. Figure 3 shows the same overlay for the default scenario (floor = -100 dBc/Hz), displaying all three PSD regions.
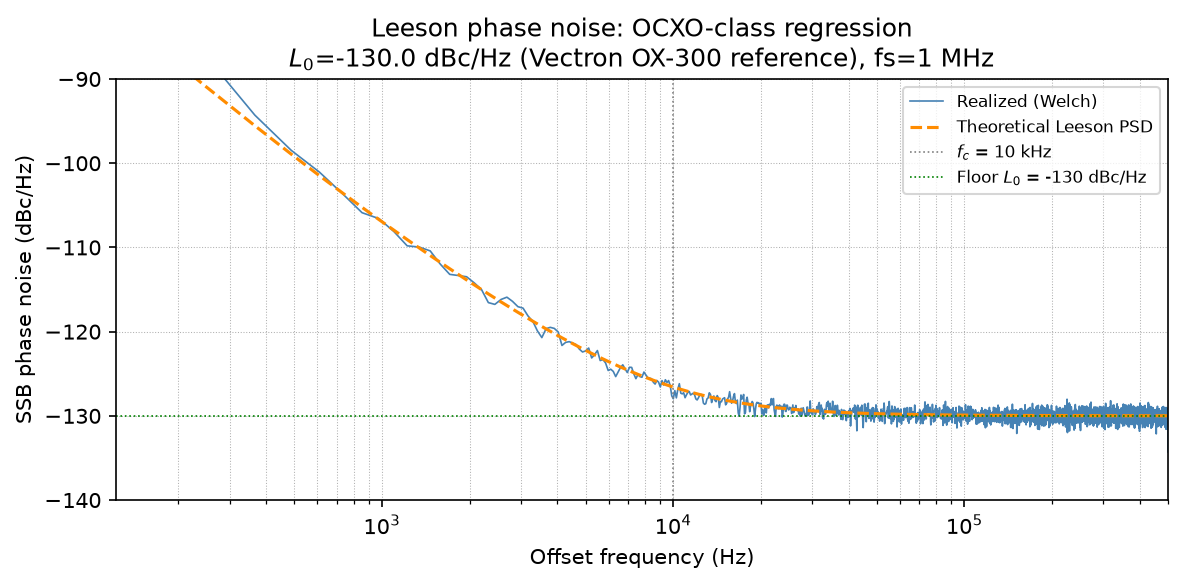
Figure 2 shows the median Welch PSD (blue) overlaid on the analytical Leeson curve (orange dashed) for the OCXO-class test case (L₀ = -130 dBc/Hz, N = 2^18). The horizontal green dashed line marks the prescribed floor. Measured deviation from theory is 0.05 dB, within the ±3 dB tolerance.
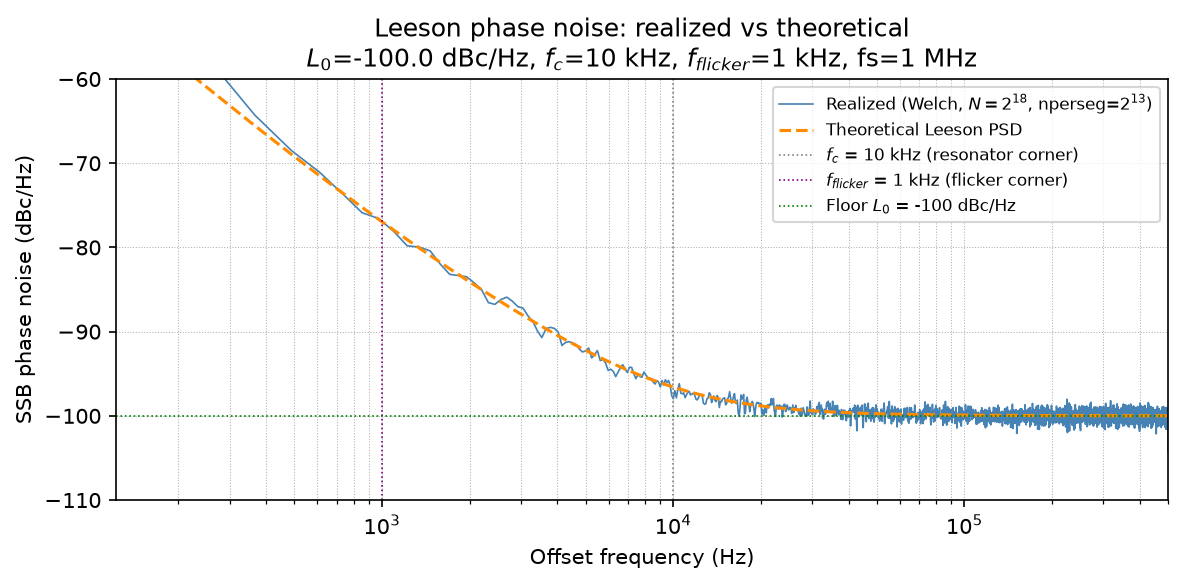
Figure 3 shows the realized Welch PSD (blue) and theoretical Leeson PSD (orange dashed) for the default parameters. Vertical lines mark fc = 10 kHz (gray, resonator corner) and f_flicker = 1 kHz (purple, flicker corner). The horizontal green line marks the floor L₀ = -100 dBc/Hz. The three spectral regions: flat floor, 1/f² resonator roll-up, and 1/f flicker at low offset, are visible in both curves.
Tests. test_empirical_known_results.py::test_psd_floor_matches_theory_default; test_empirical_known_results.py::test_psd_floor_matches_theory_ocxo_class.
Result. Both tests pass with measured floor deviations under 0.05 dB at N = 2^18.
3.5 PSD shape: resonator corner¶
Claim. At f = fc, the Leeson formula predicts a 3.01 dB rise above the floor (10·log₁₀(2)). The empirical Welch PSD at that frequency is within ±3 dB of the theoretical value.
This is the Bode half-power point of the resonator term: at Δf = fc, the term (fc/Δf)² = 1, so 10·log₁₀(1+1) = 3.01 dB. With the additional flicker term at f = 10 kHz (flicker corner = 1 kHz): 10·log₁₀(1 + 1000/10000) = 0.41 dB, the total expected uplift above floor is approximately 3.4 dB.
Tests. test_empirical_known_results.py::test_psd_shape_at_fc.
Result. The realized Welch estimate at f = fc is within ±3 dB of the theoretical value. Test passes.
3.6 PSD shape: flicker region¶
Claim. At f = f_flicker, the full Leeson PSD exceeds the resonator-only contribution by at least 1 dB, confirming the 1/f flicker term is present and active.
At the flicker corner f = f_flicker, the flicker term contributes 10·log₁₀(1 + f_flicker/f_flicker) = 10·log₁₀(2) = 3 dB above the resonator-only curve. The test uses f_flicker = 2 kHz and fc = 10 kHz to ensure the flicker corner is well above the FFT bin spacing. The 1 dB lower bound (rather than the theoretical 3 dB) accounts for Welch estimator variance at low frequencies.
Tests. test_empirical_known_results.py::test_psd_flicker_region.
Result. Measured uplift at f = f_flicker exceeds 1 dB. Test passes.
3.7 Determinism and TX/RX parity¶
Claim. The synthesizer is deterministic: the same seed and parameters produce bit-identical phi[n] across independent calls. LeesonTXPhaseNoise and LeesonRXPhaseNoise use the identical synthesizer call, so they produce bit-identical IQ for matched seeds and parameters.
Both TX and RX wrappers import and call rfgen._leeson.synthesize_leeson_phase_noise with the same argument mapping. No cached state or module-level mutable variable intervenes between calls. Seeding with torch.Generator.manual_seed() produces a deterministic pseudo-random sequence on the CPU.
Tests. test_experiment_contract.py::test_determinism_same_seed; test_experiment_contract.py::test_determinism_different_seeds; test_empirical_known_results.py::test_tx_rx_phi_identical; test_empirical_known_results.py::test_tx_wrapper_calls_same_synthesizer_as_rx.
Result. All four tests pass. Same seed gives byte-equal phi; different seeds give different phi; TX and RX wrappers produce bit-identical IQ for matched seeds.
3.8 Operating envelope and error surface¶
Claim. The component raises ValueError for invalid inputs (n_samples ≤ 0, sample_rate_hz ≤ 0) and produces finite, well-formed output across the verified parameter range.
Verified safe ranges:
Parameter |
Tested lower bound |
Tested upper bound |
Verified by |
|---|---|---|---|
|
-180 dBc/Hz |
any negative float |
|
|
1 Hz |
1 MHz |
|
|
1 |
memory-limited |
|
|
> 0 (any positive float) |
unbounded |
|
Invalid inputs raise ValueError with a message containing the parameter name ("n_samples" or "sample_rate_hz").
Tests. test_experiment_contract.py::test_n_samples_zero_raises; test_n_samples_negative_raises; test_sample_rate_zero_raises; test_sample_rate_negative_raises; test_robustness_envelope.py::test_very_negative_floor_no_nan; test_extreme_fc_1hz_no_crash; test_extreme_fc_1mhz_no_crash; test_n_samples_one_finite; test_tiny_n_samples_finite.
Result. All boundary tests pass.
4. Limits and what’s not validated¶
Operating envelope. PSD characterization (the Welch-estimated PSD matching theory) requires N ≥ 2^14. At N < 16 the FFT has too few bins to resolve the Leeson PSD shape; the synthesizer produces finite output but the PSD is not meaningful. When fc < df = fs/N, the resonator rolloff compresses into a sub-bin region and is unresolved. When f_flicker ≥ fc, the three-region model assumes f_flicker < fc; the synthesizer produces finite output but the spectral shape is physically non-standard.
Supply-ripple spurs. Real oscillators exhibit coherent tones at the AC mains frequency (50 or 60 Hz) and harmonics from power-supply ripple. This model produces only continuous Gaussian phase noise. Coherent spurs require a separate additive deterministic-tone module.
PLL-reference leakage spurs. A PLL-locked (phase-locked loop, a feedback circuit that locks an oscillator to a reference frequency) oscillator typically shows a residual tone at the PLL reference frequency at -50 to -70 dBc. Not modeled.
Close-in 1/f³ region. The Leeson three-region formula does not include the 1/f³ frequency-flicker term described by Cutler and Searle (1966). The synthesized PSD below approximately 100 Hz offset is not physically accurate for most oscillator types. A clamp_min(1e-12) guard in the formula keeps the computation numerically finite at zero offset, but the close-in region is not validated.
AM noise. Real oscillators exhibit amplitude noise (AM noise, random fluctuations in signal amplitude; distinct from PM (phase-modulation) noise which affects only the signal phase) typically 10-20 dB below the phase noise. This model produces only PM noise; the output envelope is preserved exactly by construction.
Temperature dependence. OCXO and TCXO phase noise varies with temperature, particularly during warmup. This model uses fixed parameters with no temperature input.
The present component is scoped to the Leeson three-region PSD only and is fully validated within that scope. The six exclusions listed above are out-of-scope for this component and are candidates for separate overlay modules at the device-fingerprint or scene-composition layer.
5. References¶
Published works¶
Citation |
Identifier |
Role |
|---|---|---|
Leeson, D. B., “A Simple Model of Feedback Oscillator Noise Spectrum,” Proceedings of the IEEE, 54(2), 329–330, 1966. |
Primary source for the three-region Leeson PSD formula |
|
Rohde, U. L., Microwave and Wireless Synthesizers: Theory and Design, 2nd ed., Wiley, 1997. |
ISBN: 978-0-471-52019-3, Chapter 7 (Eq. 7.7: SSB-to-two-sided conversion) |
SSB-to-DSB baseband-phase PSD conversion used in |
Oppenheim, A. V., and Schafer, R. W., Discrete-Time Signal Processing, 3rd ed., Pearson, 2010. |
ISBN: 978-0-13-198842-2, Sections 8.1 (DFT normalization) and 8.4 (Welch estimator) |
DFT normalization conventions for irfft scaling; Welch estimator derivation |
Welch, P. D., “The Use of Fast Fourier Transform for the Estimation of Power Spectra,” IEEE Trans. Audio Electroacoust., AU-15(2), 70–73, 1967. |
Welch averaged-periodogram estimator used in all empirical PSD tests |
|
Cutler, L. S., and Searle, C. L., “Some Aspects of the Theory and Measurement of Frequency Fluctuations in Frequency Standards,” Proceedings of the IEEE, 54(2), 136–154, 1966. |
1/f³ close-in region (cited in §4 limitations; not implemented) |
|
Crystek Corporation, CVCO55 Series VCO Data Sheet, 2019. |
Vendor homepage: https://www.crystek.com/ |
TCXO-class -110 dBc/Hz reference for empirical comparison |
Vectron International, OX-300 OCXO Product Specification, 2018. |
Original vendor URL no longer resolves (Vectron acquired by Microchip Technology 2014). Specification value -130 dBc/Hz at 1 kHz offset is cited from the original product data sheet. |
OCXO-class -130 dBc/Hz reference for |
Libraries¶
PyPI distribution |
Installed version |
Documentation |
Role in validation |
|---|---|---|---|
|
2.12.1 |
|
|
|
1.18.0 |
https://docs.scipy.org/doc/scipy/reference/generated/scipy.signal.welch.html |
|
|
2.4.6 |
Array operations in test helpers and figure generation |
|
|
3.11.0 |
Figure generation ( |